
Elasticity Model Between NAND Flash Bit Growth and ASP
The NAND flash industry lives at the intersection of relentless technological progress and equally relentless price pressure. Every year, process shrinks, 3D layer increases, and cell innovations expand the number of bits that can be produced per wafer. At the same time, average selling prices (ASP) tend to decline over the long run, making flash more affordable while challenging vendor margins. Understanding the elasticity between NAND flash bit growth and ASP—how changes in bit output relate to price movements—is essential for anyone forecasting the memory market or planning investments tied to storage costs.

This blog post develops an intuitive elasticity model linking NAND bit growth to ASP behavior, explains the economic logic behind it, and discusses how this relationship is influenced by technology, demand, and strategic supply decisions. The goal is not to produce a single exact formula, but to frame a structured way of thinking about how bit supply interacts with pricing over the cycle.
Defining bit growth and ASP in the NAND context
Bit growth in NAND refers to the year‑over‑year increase in total bits shipped by the industry. It reflects both capacity expansions (more wafers and more fabs) and density improvements (more bits per wafer through higher layer counts, more bits per cell, and better yields). Over long periods, bit growth rates for NAND have typically been high, often in the double‑digit percentage range.
ASP represents the average price per unit of NAND sold, which can be expressed per gigabit, per gigabyte, or per device depending on the data source. ASPs incorporate all segments—client SSDs, enterprise SSDs, mobile storage, embedded solutions—and mix effects such as capacity and performance tiers. Historically, ASPs trend downward over time but can experience cyclical upswings or stability in certain phases.
Elasticity in this setting measures how sensitive ASP is to changes in bit growth: when bit growth is faster or slower than demand growth, how strongly do prices react?
Economic intuition: supply, demand, and price

The foundational intuition comes from basic supply and demand. If industry bit supply grows faster than demand for NAND‑based storage, excess supply builds, and ASPs tend to fall. If bit supply lags demand, shortages or tightness arise, and ASPs can stabilize or rise.
However, NAND is not a simple commodity. Demand itself is elastic with respect to price: as ASPs fall, more applications adopt flash, capacity configurations increase, and new device categories emerge. This means that bit growth does not mechanically translate into oversupply and price collapse; some of the extra bits get absorbed by expanding usage.
An elasticity model must therefore consider both the direct effect of supply on price and the feedback loop by which lower prices stimulate additional demand, partially offsetting supply shocks.
Basic elasticity framework: percentage changes and ratios
To frame the relationship, imagine two key variables for a given year: the percentage growth in bit output, and the percentage change in ASP. An elasticity coefficient can be defined as the ratio between these percentage changes, capturing how strongly price reacts to supply growth relative to demand.
For example, if bit supply grows 30% and ASP falls 15%, one could say the price elasticity with respect to bit growth in that period is roughly 0.5 in magnitude (15% ÷ 30%), though the sign is negative because higher supply is associated with lower prices. In other years, bit growth may be lower and ASP declines milder, implying a different elasticity.
Empirically, such ratios vary over time, but they can be grouped into regimes to understand typical behavior under different market conditions.
Three regimes of NAND bit growth

For modeling purposes, it helps to distinguish three regimes of bit growth relative to demand: balanced, oversupply, and constrained. In the balanced regime, bit growth is roughly aligned with demand growth, and ASP tends to follow longer‑term technology trends rather than sharp cyclical swings.
In the oversupply regime, bit growth significantly exceeds demand. Here, inventories rise, competition intensifies, and ASP declines accelerate; elasticity values in this regime are larger in magnitude because price reacts more sharply to excess bits. Vendors may cut utilization or delay expansions to slowly re‑balance supply.
In the constrained regime, bit growth lags demand. Tight supply and supply‑chain shocks can allow ASPs to stabilize or rise, particularly in specific segments. Elasticity is smaller in magnitude—or even temporarily positive—because additional bit growth, when it eventually arrives, may stabilize or reduce high prices rather than cause large declines.
Long‑run structural relationship: cost curves and ASP floors
Over long horizons, NAND ASPs are anchored by cost curves. Each new technology generation can reduce cost per bit by improving density and process efficiency, creating room for lower ASPs while preserving margins. However, there is an effective floor driven by manufacturing cost and required return on capital; ASPs cannot fall indefinitely without prompting capacity cuts.
This introduces an asymmetry in elasticity. When bit growth is modest and close to demand, ASP declines may be limited by cost floors, yielding smaller price responses. When bit growth is aggressive, price declines can push closer to cost levels, eventually triggering corrective actions that damp further elasticity.
An elasticity model therefore must incorporate cost‑based constraints: in years where ASP nears cost, additional bit growth may not produce proportional price drops because supply adjustments intervene.
Technology transitions: 3D layers, QLC, and elasticity shifts
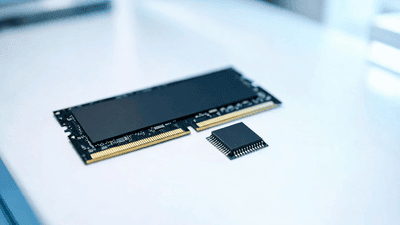
Technology transitions influence elasticity by changing how much bit growth is achievable at given CapEx and by altering cost structures. Higher 3D layers and QLC adoption can produce steep bit growth from the same wafer input, raising the potential for oversupply if demand does not keep pace.
At the same time, these technologies can lower cost per bit significantly, allowing ASPs to decline without compressing margins as severely. In such phases, elasticity between bit growth and ASP may be relatively high (prices respond strongly to extra bits) but still economically tolerable for producers because costs are falling too.
Once these transitions mature and bit growth normalizes, elasticity can decrease as differential advantages between vendors narrow and marginal cost improvements slow.
Demand elasticity: how lower ASPs create new demand
To refine the model, demand elasticity must be included. Demand for NAND is sensitive to price: as ASP falls, device makers can increase standard capacities, and new categories—such as entry‑level SSDs replacing HDDs, or more storage in AI devices—become viable.
This means that bit growth that would otherwise be excessive can be partially absorbed by price‑stimulated demand. For example, if bit supply rises 30% but demand elasticity is such that a 15% ASP decline increases demand by 10–15%, the net oversupply is smaller than initially implied, and ASPs may stabilize sooner.
In elasticity modeling, this feedback loop is captured by interactions between supply growth, price changes, and quantity demanded, making the net elasticity between bit growth and ASP lower than a simple supply‑only model would suggest.
Inventory and cycle dynamics
Inventory behavior adds another layer. When bit growth outpaces demand, inventories accumulate. Vendors respond by adjusting output, managing shipments, and potentially accepting lower ASPs to clear stock. Inventory levels amplify price responses because they represent excess bits already in the system, not just future production.
During inventory digest phases, bit growth may be reduced while ASPs still remain under pressure due to elevated stock. In these periods, elasticity between current bit growth and ASP may appear weak: even modest bit growth can coincide with significant price declines because past oversupply is still being worked down.
An effective model therefore considers not only current bit growth but also inventory positions as state variables influencing ASP responses over time.
Segment mix: client vs enterprise vs mobile
NAND is deployed across segments with different sensitivities to price and capacity. Client SSDs and consumer devices are highly price‑sensitive; lower ASPs quickly translate into higher capacities and broader adoption. Enterprise and data‑center SSDs, while also price‑sensitive, place additional value on performance and durability and may respond differently to price moves.
Mobile and embedded segments often follow platform cycles, with capacity decisions tied to product roadmaps more than short‑term price; elasticity here can be lagged or muted. If bit growth is concentrated in segments with high price elasticity, ASPs can adjust more efficiently; if growth is skewed toward less elastic segments, imbalances persist longer and price responses can be more abrupt once they occur.
In modeling, segment mix is a key input: aggregate elasticity between bit growth and ASP is a weighted outcome of several sub‑elasticities across usage domains.
Simple illustrative model: thresholds and slopes
One way to capture these dynamics is to use a piecewise elasticity model. Assume there is a “balanced growth” threshold where bit growth matches expected demand growth, and ASP declines follow a modest structural trend linked to technology (for instance, single‑digit annual decreases).
When bit growth exceeds this threshold—say by more than a few percentage points—elasticity increases: each additional percentage point of excess bit growth leads to a larger marginal ASP decline. Conversely, when bit growth falls below the threshold, ASP declines may slow, stop, or even reverse temporarily, with elasticity falling toward zero or turning positive.
In this simplified representation, elasticity is not a constant but a slope that steepens when supply strongly outruns demand and flattens when supply and demand are aligned or when supply is constrained.
Strategic behavior: utilization cuts and pricing discipline
Vendor behavior moderates elasticity. When bit growth is high and ASPs decline rapidly, major NAND producers can implement utilization cuts, delay equipment installations, or adjust product mix to damp supply growth. These actions effectively reduce the elasticity between bit growth and ASP by limiting how far prices can fall before production responds.
Pricing discipline, such as avoiding aggressive price‑cutting in oversupplied markets, also plays a role. If vendors choose to prioritize margins over volume, ASPs may stabilize even when bit growth is elevated, lowering observed elasticity.
In contrast, during intensely competitive phases, where vendors chase market share, elasticity can increase as price competition amplifies the impact of oversupply on ASPs.
Implications for forecasting and investment
For forecasters and investors, an elasticity model between NAND bit growth and ASP is a tool to translate capacity and technology assumptions into price scenarios. If models predict strong bit growth from layer increases and process transitions, the elasticity framework helps estimate how far ASPs might fall under different demand and inventory conditions.
Investors can use elasticity ranges to stress‑test projections: under a high‑elasticity scenario, aggressive bit growth results in substantial ASP declines and margin pressure; under a lower‑elasticity scenario with strong demand uptake and disciplined supply, price erosion is more moderate. These scenarios help gauge risk and potential upside tied to NAND cycles.
System designers and OEMs, in turn, can use forecasts informed by elasticity to plan product capacities, pricing, and feature sets, anticipating when storage may become cheap enough to enable new device categories or architectural shifts.
Limitations and evolving parameters
No elasticity model for NAND bit growth and ASP is static or universally precise. Structural changes—such as shifts toward enterprise SSDs, embedded AI storage, or new technologies—alter both demand elasticity and cost curves. Vendor strategies, macroeconomic conditions, and alternative storage options also influence how bit growth translates into price behavior.
Models must be updated regularly with new data and insights, treating elasticity coefficients as evolving parameters rather than fixed constants. It is more realistic to think in terms of ranges and regimes than exact equations.
Despite these limitations, a well‑constructed elasticity framework remains valuable, turning qualitative narratives about “oversupply” or “tight markets” into more quantified expectations and structured scenario planning.
Conclusion: elasticity as a lens on the NAND cycle
The relationship between NAND flash bit growth and ASP is central to the industry’s economics, and elasticity provides a useful lens to understand it. Bit growth, driven by technology and investment, interacts with demand, cost curves, inventories, and strategic behavior to shape price trajectories.
By modeling this interaction—recognizing different regimes, feedback loops, and constraints—stakeholders can better anticipate how the next waves of bit expansion will impact pricing and margins. While exact numbers will always be uncertain, the elasticity perspective helps ensure that discussions about NAND supply and price are grounded in coherent, quantitative logic rather than intuition alone.
You May Like

Narrowing Spread Between NAND Spot and Contract Prices in 2026 – A Signal
By 2026, one of the most watched metrics in the NAND flash market has started to shift in a subtle but meaningful way: the spread between spot prices and long‑term contract prices is narrowing. For casual observers, this may look like just another incremental change in a notoriously volatile industry. For memory makers, module houses, device OEMs, and data center buyers, however, a tightening gap between spot and contract prices is a signal—a reflection of evolving supply–demand balance, risk perceptions, and strategic behavior on both sides of the market.

Price Divergence Trading Strategies Between NAND Flash and DRAM ETFs
NAND flash and DRAM sit at the core of AI storage and computing power. Both are memory, but they are not the same business. DRAM is main memory—fast, volatile, and central to high‑bandwidth workloads like AI training and inference. NAND is non‑volatile storage—slower than DRAM, but crucial to persistent data and large‑scale object storage. The cycles that drive their pricing and margins overlap, yet they often diverge. That divergence is where trading strategies between NAND and DRAM ETFs become interesting.

China’s HBM Localization Progress: The Catch-Up Pace of CXMT and XMC
China’s drive to localize advanced memory technologies has accelerated over the past several years. High-Bandwidth Memory (HBM) sits near the center of that strategy because it is integral to AI accelerators, high-performance computing (HPC) and other strategic compute platforms. Two domestic players—ChangXin Memory Technologies (CXMT) and XMC (Xianghui Memory, commonly referred to as XMC)—have become focal points in assessing how quickly China can close the gap with international incumbents on HBM die, stacking, and packaging.

Thermal Simulation Challenges and Solutions in 3DIC AI Chip Design
As AI workloads push chips to deliver ever higher compute density, designers are increasingly turning to three‑dimensional integration (3DIC) to stack dies vertically and pack more functionality into limited footprints. While 3DIC architectures unlock significant performance and bandwidth advantages, they also introduce complex thermal behaviors that are far harder to predict and manage than in traditional 2D layouts.

An Attempt at Compiling a Memory+Compute Fusion Thematic Index – A Dual-Track Framework
Most AI investors talk about “compute” as if it were the whole story: GPUs, accelerators, chips, cores. But every one of those cores needs somewhere to read from and write to. Memory and storage define how wide the data highway really is. In practice, AI performance is a fusion of compute and memory, not a solo act. So why do so many indices and ETFs separate them into different silos—one for semiconductors, one for memory, one for data centers—when the actual workloads keep blending them?

Surging Demand for Laser Drilling and Plasma Dicing Equipment in Advanced Packaging
Advanced packaging has become one of the semiconductor industry’s most important growth engines, and it is now pulling a surprising set of process tools into the spotlight. Among the most in-demand are laser drilling and plasma dicing equipment. These machines sit close to the heart of heterogeneous integration, fan-out packaging, wafer thinning, TSV formation, glass substrate processing, and other advanced flows where precision, yield, and throughput matter enormously. As packaging moves from a back-end afterthought to a strategic platform, the equipment used to shape, open, and separate materials has become just as important as the dies themselves.

D2D Interface Bandwidth and Latency Comparison in Chiplet Architectures
Chiplet architecture has turned the package into a real performance battleground. Once multiple dies are placed side by side or stacked within the same advanced package, the quality of the die-to-die, or D2D, interface becomes one of the most important determinants of system behavior. Bandwidth is no longer a nice-to-have metric, and latency is no longer a small implementation detail. Together, they shape whether a chiplet system feels nearly monolithic or frustratingly fragmented.

Stock Selection Logic and Alpha Validation of ESG-Themed Semi ETFs
Semiconductor themed ETFs are no longer just about growth and cycles. A growing subset now layers environmental, social, and governance (ESG) criteria on top of traditional sector exposure. These ESG semi ETFs promise two things at once: access to one of the market’s most powerful secular themes, and alignment with sustainability and governance standards. The pitch is appealing, but it raises two hard questions. First, how exactly are these stocks being selected? Second, does the ESG overlay help, hurt, or leave alpha unchanged?